The dashboard to the left is the stakeholder-facing layer of a digital twin for a CNC manufacturing cell. A CNC cell is a self-contained cluster of machines and robots that turns raw material blanks into finished parts through subtractive manufacturing in one automated workflow: a hopper feeds material, cobots load it into a milling machine, the machine cuts, the cobots extract and clean the part, the finished piece lands in an outbox. A digital twin is a software system that mirrors the physical cell closely enough to support decisions about it. The four tabs across the top are four such decision surfaces. The integrity flag in the top right, cycled by clicking, is the pivot the project is built around.
What Was Built
Every predictive system has a confidence problem. The system produces an estimate, attaches a confidence score, and the operator acts on both. But the confidence score is the system's self-assessment, and self-assessment has a structural blind spot: a vibration sensor with a loosened mount does not report "unreliable." It reports a shifted value. The model downstream reads the shift as a changed cutting condition. Its confidence stays high. Its prediction is anchored to a reference point that no longer exists.
The architecture behind this dashboard is built around that problem. The question is not how to make predictions; it is how to make the system's confidence in those predictions track reality rather than its own internal consistency. The four stakeholder views and the integrity flag cycling in the top bar are the visible surface of that answer. The full system, covering sensor integration, inference, scheduling, feedback, and governance, is specified in a separate architectural report and implemented in software. The numbers on this page are illustrative, chosen to make the system's behavior legible. The architecture is real.
The System Beneath the Dashboard
The interface represents the top layer of a multi-layer stack. Read the diagram from the bottom up, but the interesting decisions are not in the layers. They are in three places where the architecture departs from a standard predictive-maintenance pipeline.
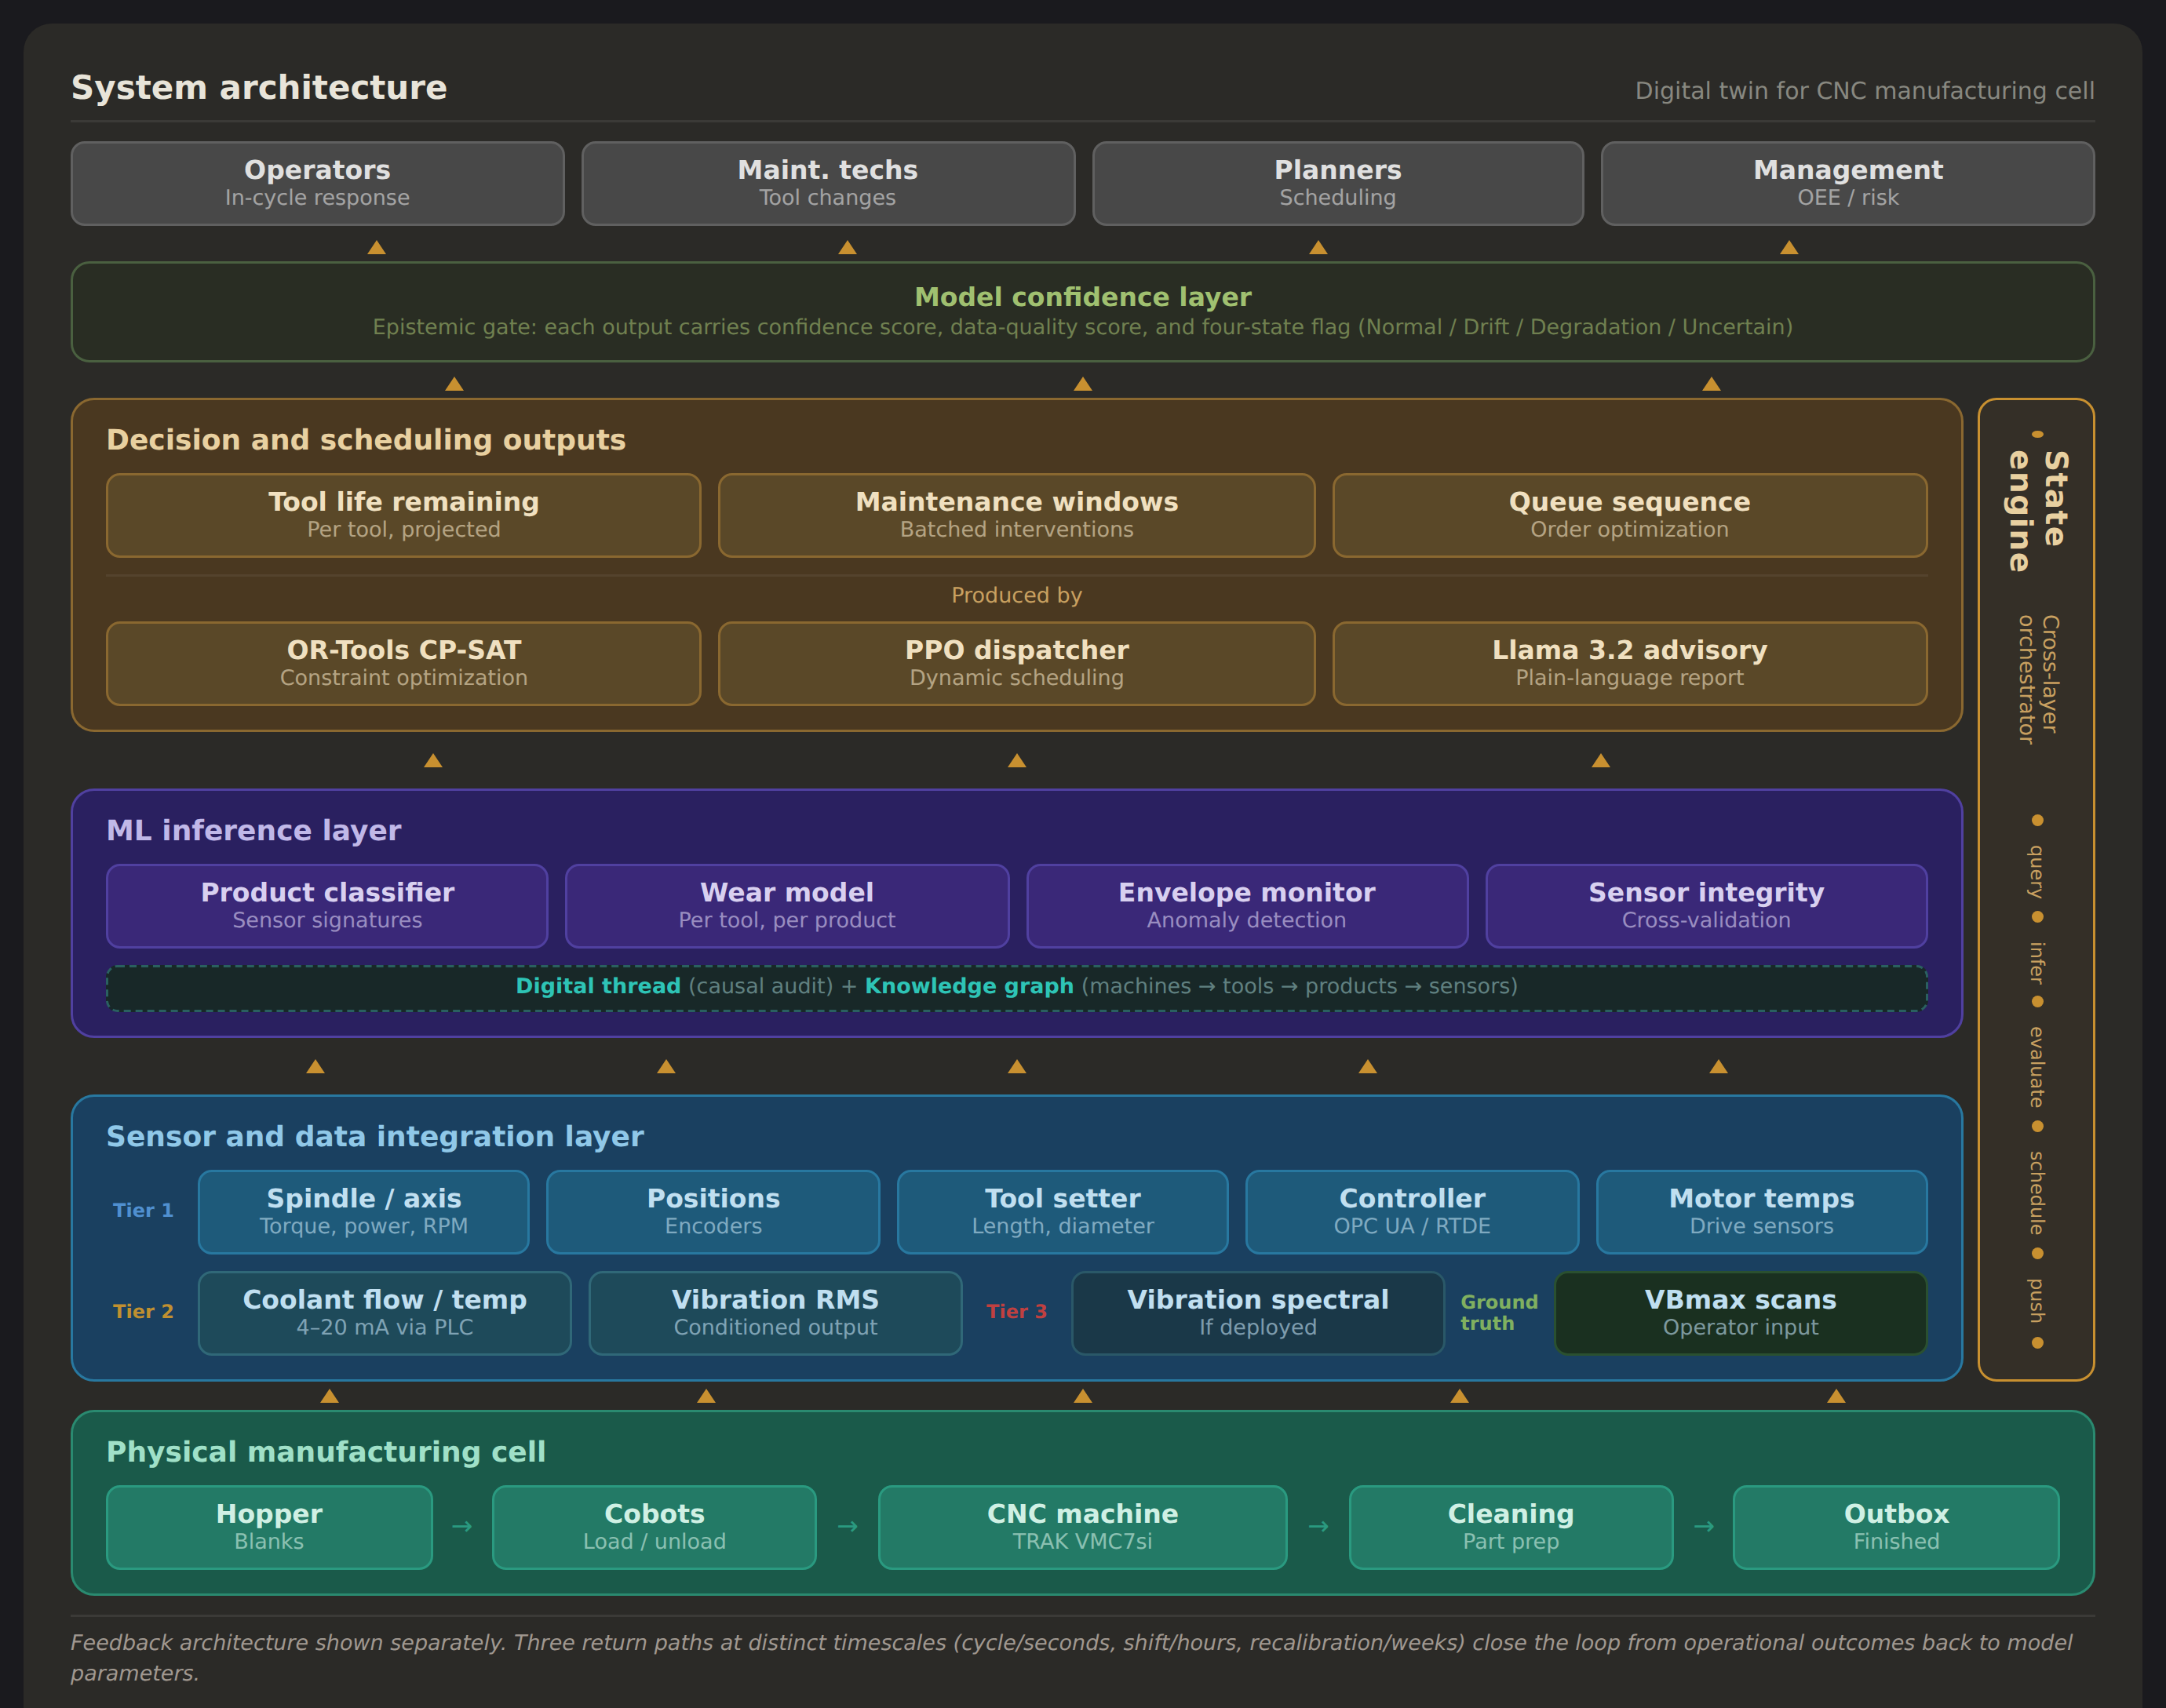
The first is the sensor strategy. The cell's CNC controller already monitors spindle torque, axis currents, RPM, and program state for its own closed-loop control. The twin reads these signals as a secondary consumer: no new hardware, immediate value. This is the behavioral twin, the observational layer, and it runs from day one before any predictive model is trained. Additional sensor tiers exist in the architecture but are deployed only if the first tier proves insufficient. Whether high-frequency spectral vibration is needed for accurate wear modeling is an empirical question the calibration phase answers, not a decision the architecture makes in advance.
The second is the product classifier. The cell manufactures three products from similar aluminum blanks, each consuming tools at a different rate. Before the system can estimate how much life a tool has left, it must identify which product is being cut. That classification is not a value feeding into a formula. It is a routing decision: the classifier's output selects which wear trajectory governs every subsequent prediction. A misclassification does not add noise. It selects the wrong trajectory entirely. This distinction, between uncertainty that widens a confidence band and uncertainty that selects a different model, is where the pipeline's compound error originates. The later section on uncertainty traces it in detail.
The third is the green band across the top of the diagram. That is the model confidence layer, and it is the heart of the design. In a standard pipeline, confidence is metadata: a number attached to a prediction, visible if you look for it. Here, confidence is a first-class output. Nothing reaches a stakeholder without a score and a four-state integrity flag. The flag does not report how certain the model is about its prediction. It reports whether the model's inputs and assumptions still hold: a different question, answered by a different mechanism, demanding a different response when the answer is no.
The rest of the essay is about why that distinction matters and what happens when the integrity state changes.
Open the Operator view and follow along.
Four Clocks, One Cell
The Operator view is the first tab for a reason. Its timescale is seconds: the current cycle, this tool cutting this product right now. Tool life bars show what is being consumed; the job queue shows what is about to consume them. Click any tool bar to expand its detail. The confidence envelopes on the RUL timeseries matter as much as the point estimate: RUL means remaining useful life, and fifty more cycles ±5 is a different operational object than fifty ±40. Same number, different decisions.
Switch to the Technician view. The timescale lengthens to hours. The alert log shows a shift's worth of events, expandable to the diagnostic reasoning behind each one. The tool magazine segments per-tool wear by product, because the same tool wears at different rates depending on what is being cut, and the composite state is what the technician needs to see. Click a tool to open its wear history: stacked bars tracking cumulative cutting across time, with vertical markers at each scan, inspection, or replacement.
The Planner view moves the timeline out to a week. Seventeen orders across fourteen shifts. Each job bar is color-coded by product type and proportionally sized by duration. The "now" indicator marks where the cell is in the schedule. Wednesday's maintenance window belongs to the schedule, sized and placed by a constraint solver that treats tool life as a hard deadline. Click any bar to see the order detail.
Below the Gantt, open the value comparison. The second timeline shows the same week without predictive maintenance: a failure spike on Wednesday, hours of unplanned downtime, orders pushed into backlog. The saving is roughly 405 minutes. The number is illustrative; the structural claim is that planned and well-timed predictive maintenance is cheaper than unplanned failure, and the twin's job is to make the planned version feasible.
The Ops Manager view stretches to the quarter. Five tiles name the metrics that matter at that scale: overall equipment effectiveness, unplanned downtime, tooling cost per part, on-time delivery, prediction accuracy. Each tile has a sparkline; click one to expand its twelve-week trend. At the bottom, a row of human-in-the-loop metrics tracks the health of the relationship between the operators and the system: override rate, override effectiveness, scan compliance, system acceptance.
Why the Integrity Flag Exists
Look at the top bar. Three indicators sit together: a model confidence meter, a composite health score, and the integrity flag. Each answers a different question. Model confidence describes the system's predictive certainty: how tightly an RUL estimate is bounded, how sure the classifier is about the active product. Health rolls up the physical condition of the asset. The integrity flag reports something upstream of both, what might be called epistemic confidence: whether the system's inputs and assumptions still hold. A model can be highly confident in a prediction whose underlying sensor is quietly drifting. All three need to be visible at all times, because they fail for different reasons and demand different responses.
The integrity flag exists to counter a specific failure mode. A vibration sensor with a loosened mount does not report "unreliable." It reports a shifted value that the model downstream reads as a changed cutting condition. A power transducer with thermal drift does not ask to be recalibrated. It shifts its baseline, and the envelope monitor registers a persistent anomaly that does not correspond to any actual change in the tool. The system's internal metrics stay stable. Its recommendations look reasonable. Every one of them is anchored to a reference point that no longer exists.
A system that knows it does not know is degraded but honest; it can widen margins, flag uncertainty, escalate to human judgment. A system that believes it knows, without evidence, is confidently wrong, and that confidence becomes the mechanism of harm.
The four states are how the system makes that self-assessment legible. Cycle the integrity flag and watch what happens. Normal: everything runs, the operator works on active tasks, the system is autonomous within defined bounds. Sensor Drift Suspected: an advisory surfaces, confidence intervals widen, the maintenance window is marked provisional rather than scheduled. Degradation Confirmed: the alert escalates, the schedule replans around an immediate intervention, the Ops Manager view recalculates downstream impact. Uncertain / Ambiguous: the system presents two competing hypotheses with their probabilities and costs, and withholds scheduling decisions until the ambiguity is resolved.
The integrity flag is the system's public statement about its own reliability. It sits with equal weight beside the health score because the alternative is a system whose credibility exceeds its accuracy.
Autonomy by State
Industrial control systems are often described on a five-level autonomy scale, from fully manual at Level 0 to fully autonomous at Level 4. Level 3, supervised autonomy, is the known trap. The system operates; the human monitors. Monitoring a system that rarely needs attention is a task humans cannot sustain. Vigilance decays precisely because the system works. When the 0.1% event arrives, the human, quite naturally, is mentally absent.
The four states on the integrity flag are this project's solution for avoiding that design trap. In Normal conditions, the twin runs at Level 4, and the operator is doing active work: scan entry, maintenance confirmation, shift logging. In each of the three degraded states, the twin drops to Level 2, presenting recommendations and tradeoffs for the operator to resolve. Engagement shifts with the system's self-assessment. The co-adaptation metrics on the Ops Manager view track how well the arrangement is holding: falling override rate with stable effectiveness means shared judgment is developing; falling override rate with falling effectiveness means drift toward uncritical acceptance, the Level 3 failure re-entering through a different door.
Where Uncertainty Lives in the Pipeline
The dashboard shows what the system decides. Between sensor and stakeholder, there are specific places where the system can be wrong and specific places where it cannot catch itself.
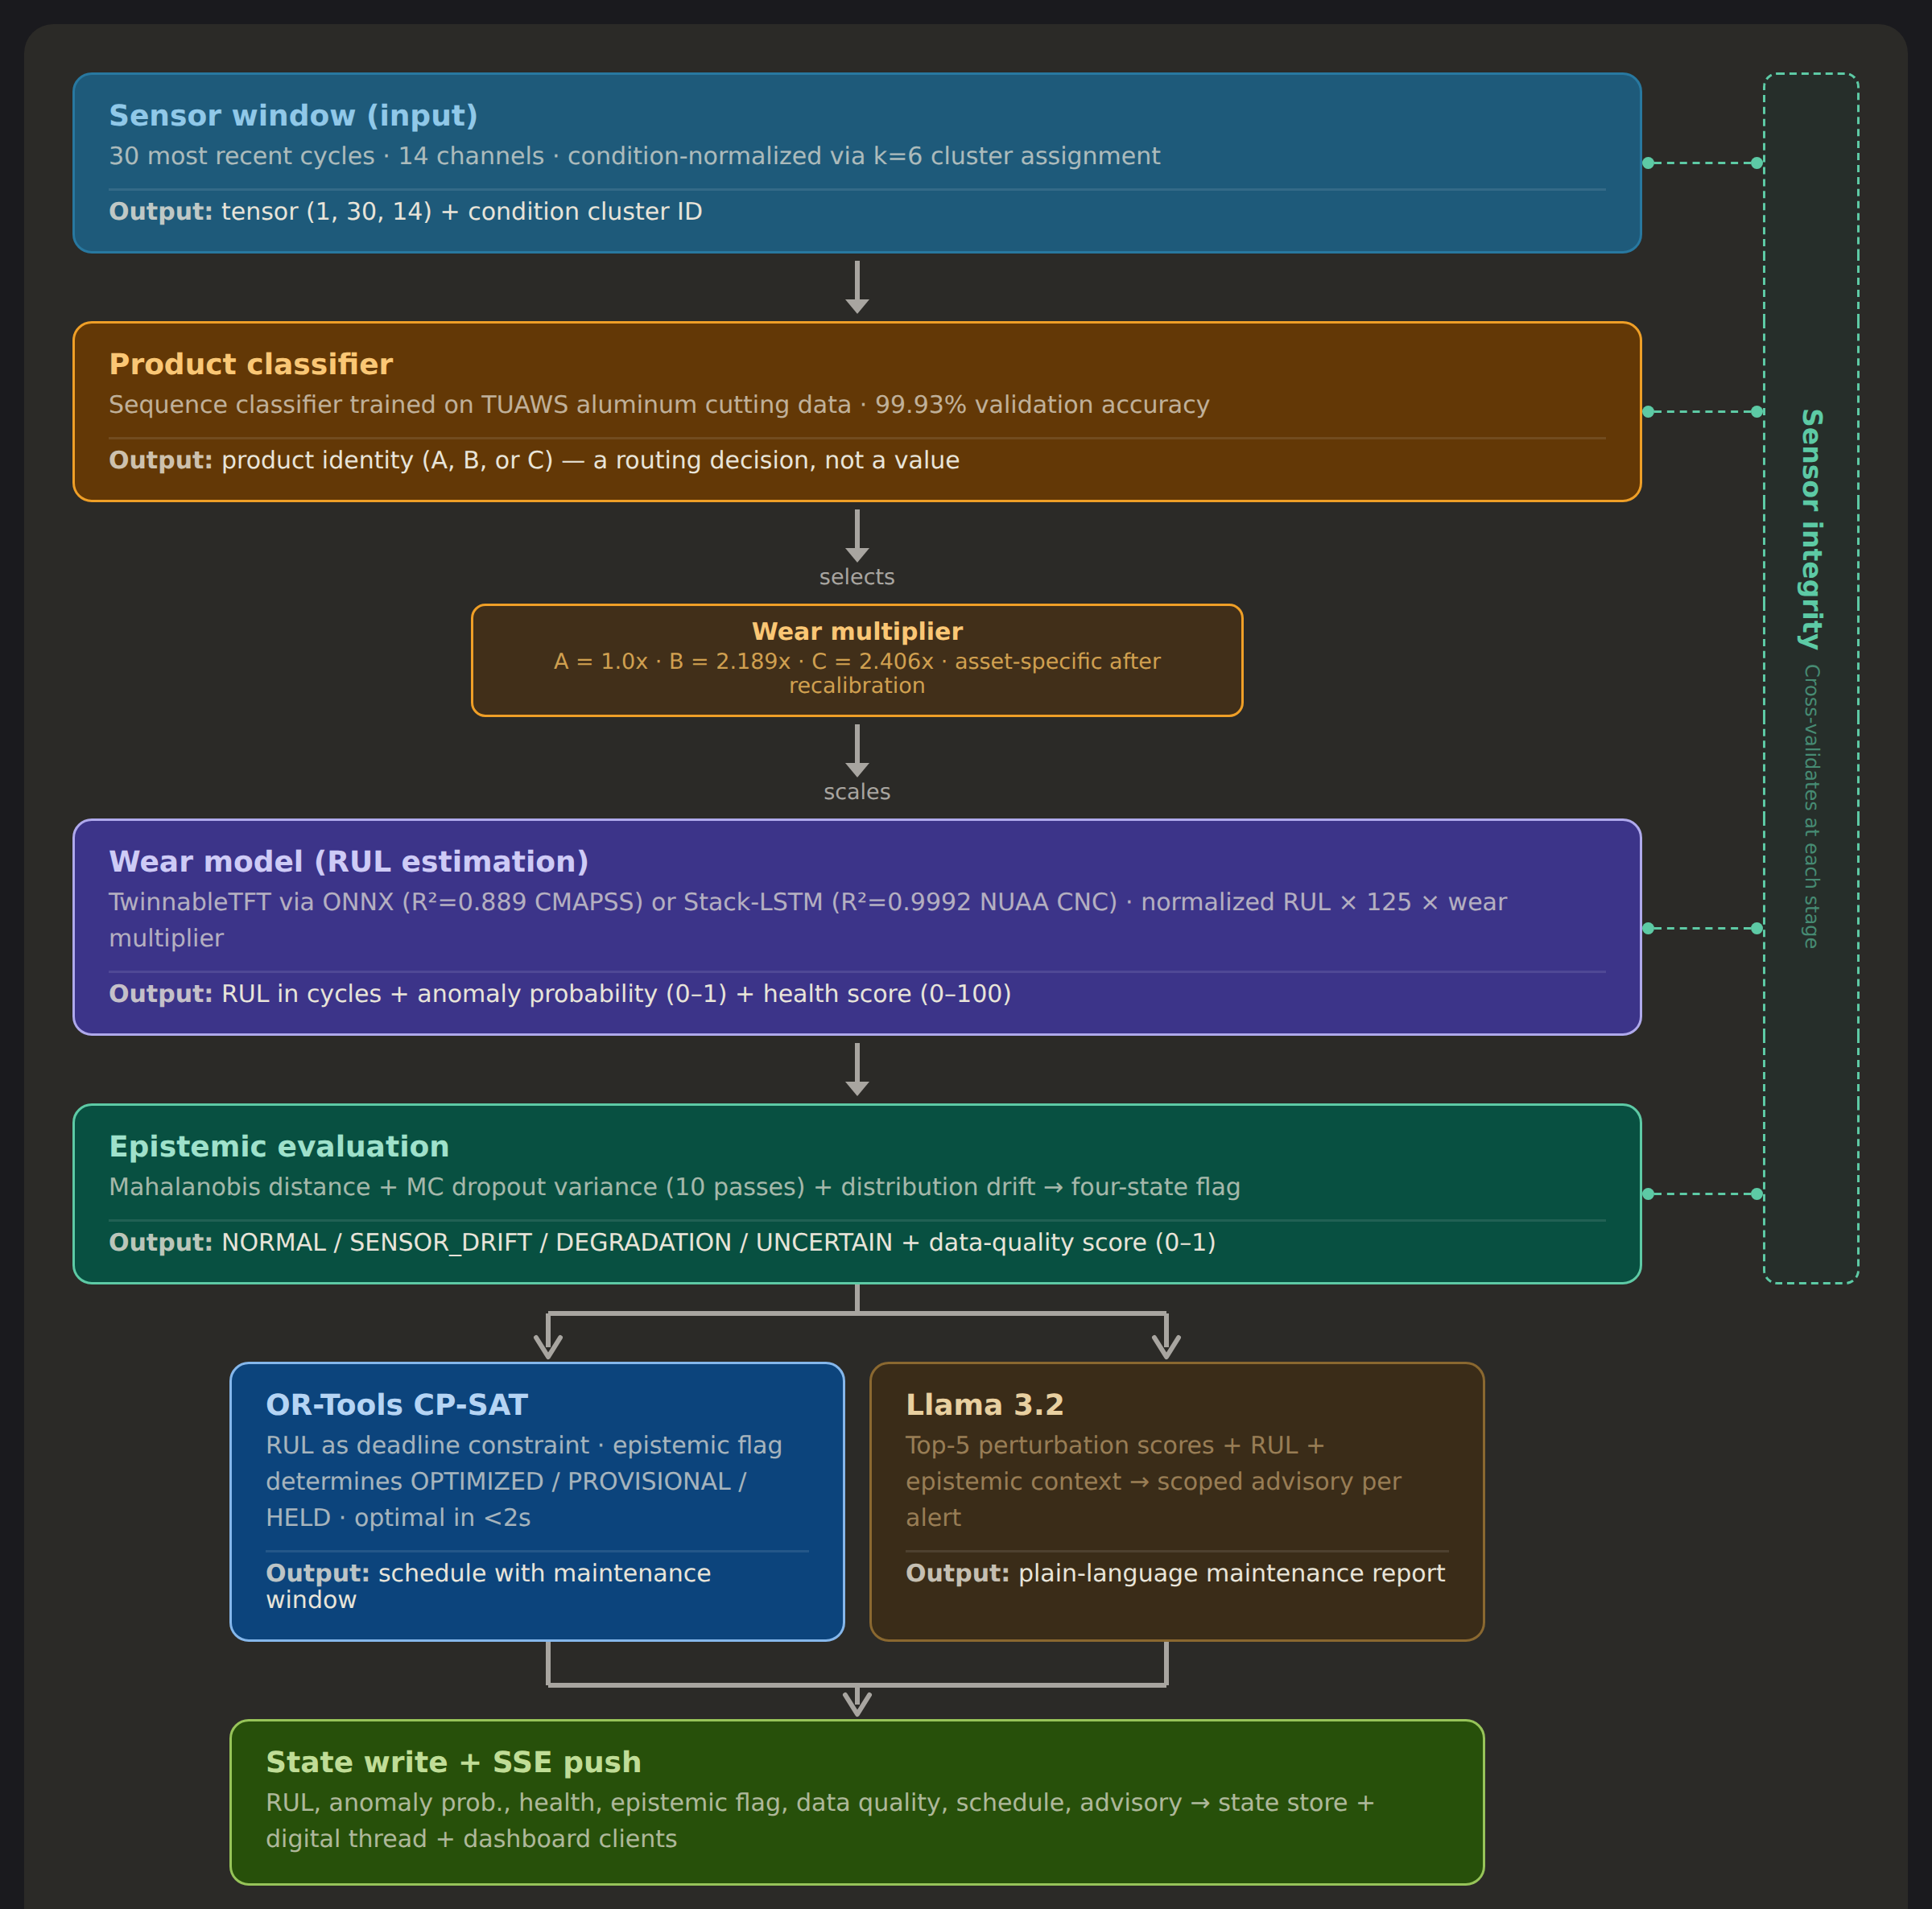
Every 30 seconds, the state engine pulls the most recent 30 machining cycles across 14 sensor channels. That window enters the product classifier first. Without knowing which of the three products is being machined, the system cannot select the correct wear multiplier.
This is where uncertainty changes character in the pipeline. At the sensor layer, noise is additive: it widens a confidence band, but the prediction stays in the right neighborhood. At the classifier, uncertainty becomes a routing decision. A misclassification does not add noise to the RUL estimate. It selects a different wear trajectory entirely. The downstream error is not proportional to the input noise; it is proportional to the gap between the selected trajectory and the correct one. At 99.93% validation accuracy, the classifier is reliable. But a confident misclassification — the rare case where the sensor signature genuinely resembles a different product under current conditions — bypasses every safeguard downstream because those safeguards are designed for the wear trajectory the classifier selected, not the real-world wear trajectory of the physical system.
Below the classifier, the wear multipliers compound the problem. The constants used at deployment (Product A = 1.0×, Product B = 2.189×, Product C = 2.406×) are derived from a different machine and different tooling. They are assumptions embedded in the inference logic itself, invisible to every confidence check the system performs. The Mahalanobis distance does not flag them because the inputs look normal. MC dropout does not flag them because the model gives consistent outputs. Every internal metric looks stable while every output carries a bias proportional to the gap between the assumed multiplier and the true one.
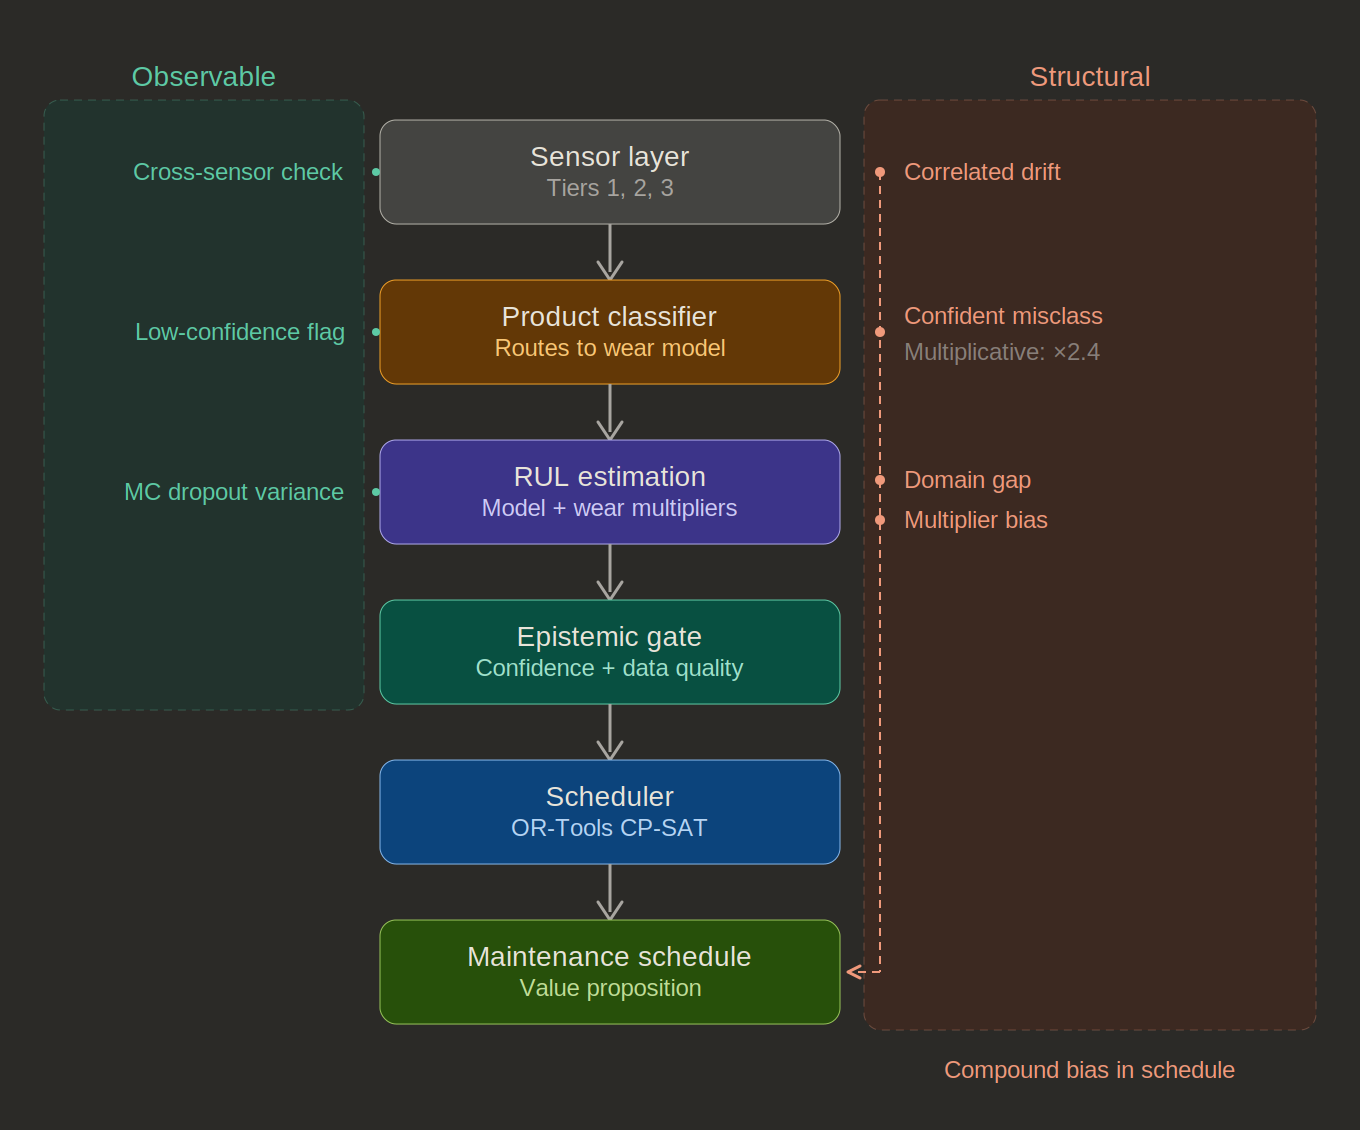
The diagram above makes visible the role of human-machine co-adaptation in mitigating systemic risks. On the left, the uncertainties the system can catch: single-sensor drift through cross-validation, low classifier confidence through escalation, high model variance through MC dropout. On the right, the uncertainties that pass through undetected: gradual correlated drift that produces no disagreeing signal, confident misclassification that selects the wrong trajectory, domain gap where the model's training distribution differs from deployment, and multiplier bias embedded as a fixed assumption. Per-model confidence checks can each pass while the compound effect accumulates at the bottom of the pipeline: a bias in the maintenance schedule that no individual checkpoint is positioned to detect.
The only measurement that catches compound error is one that checks the physical reality, not sensor inputs: predicted versus actual RUL at the moment a tool is replaced. Each replacement event is a first-class validation opportunity. It is also the entry point for the feedback architecture that resolves these structural uncertainties over time.
What the Twin Learns
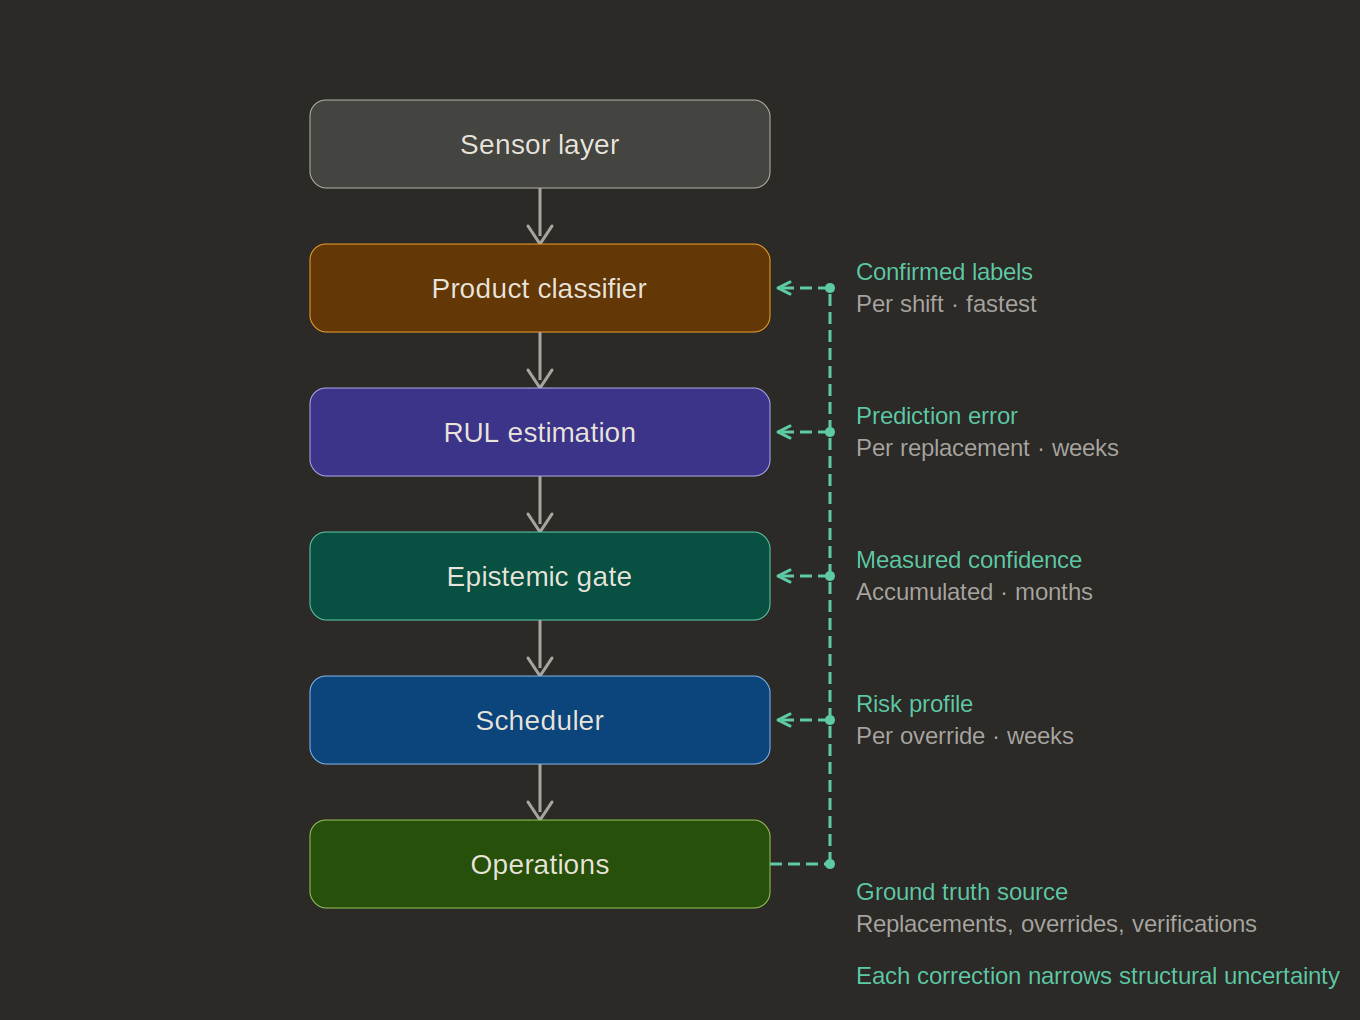
Four feedback channels connect operational ground truth to specific pipeline layers, each accumulating at a characteristic rate. Confirmed product labels arrive per shift — the fastest loop. Within weeks, the classifier's real-world accuracy is empirically measured rather than estimated from training data. Prediction error at each tool replacement arrives over weeks to months. After enough replacement events, the error distribution reveals whether errors are systematic (e.g. the model consistently overestimates by 12%, suggesting the multipliers are miscalibrated) or high-variance but unbiased (i.e. proper calibration against irreducible process variability). The former is correctable. The latter defines the floor.
At the recalibration timescale of months, the deployment-time wear multipliers are replaced by values computed from this cell's actual replacement history. A twin at deployment carries generic priors. A twin after a quarter of operation carries asset-specific parameters. Its confidence stops being assumed and starts being measured.
One more risk worth naming. If operators always replace tools before the model's predicted failure, the system never observes the outcome it was predicting. The training data becomes censored: biased toward early intervention, reinforcing the conservative behavior that produced the bias. The architecture handles this through survival analysis (Kaplan-Meier estimators and Cox proportional hazards models) which treats censored observations natively rather than discarding them. Every replacement event updates the tool life curve regardless of whether the replacement followed the model's recommendation, preceded it, or contradicted it.
The feedback rate is also self-regulating. When the system is confident, operators follow recommendations, generating expected outcomes. When the system is uncertain, operators apply their own judgment, generating overrides concentrated exactly where the model's uncertainty is genuine and additional evidence has the highest value. Early learning is fast, when everything is uncertain and overrides are frequent, tapering to targeted learning at the model's genuine uncertainty frontier.
These channels do not improve their own layer in isolation. Better classifier accuracy means the correct multiplier gets applied, which means more accurate RUL, which means better-timed maintenance, which means higher-quality ground truth for the next round of multiplier recalibration. The structural uncertainty column from the propagation analysis narrows over time because each improvement at one layer propagates through the pipeline and reduces compound error everywhere downstream. No single feedback mechanism is transformative. The compounding is. The system gets more honest about its own accuracy the longer it runs, and its honesty compounds.
Continuity
The Projection Explorer asks what happens when you compress high-dimensional data into three visible axes. Color-a-Pixel asks what happens when you compress continuous color into 120 discrete crayons. Both rest on the premise that the right computational lens does not simplify what it shows you; it shows you what was already there, including what the choice of lens has made invisible.
The digital twin asks the same question in an industrial context. A wear model compresses a thousand dimensions of cutting dynamics into a single scalar. A classifier collapses a sensor signature onto one of three labels. An envelope monitor reduces continuous deviation into a discrete flag. Each projection is useful, and each is a place the system's self-knowledge can fail silently.
What changes in the industrial case is the stakes. A projection artifact in a classroom tool produces a misunderstanding. A projection artifact in a manufacturing cell produces scrap, missed deliveries, damaged equipment, an injured operator. The portfolio's interest in making hidden computational structure visible extends naturally into this context. The integrity flag is the same move as the parallel coordinates panel and the mapping lines in CIELAB space: an instrument pointed at what the system is not telling you, placed where it cannot be looked past.
Further Reading
The full architectural report covers the system from physical characterization through governance and lifecycle planning. A separate confidence audit traces uncertainty propagation through every layer of the pipeline.